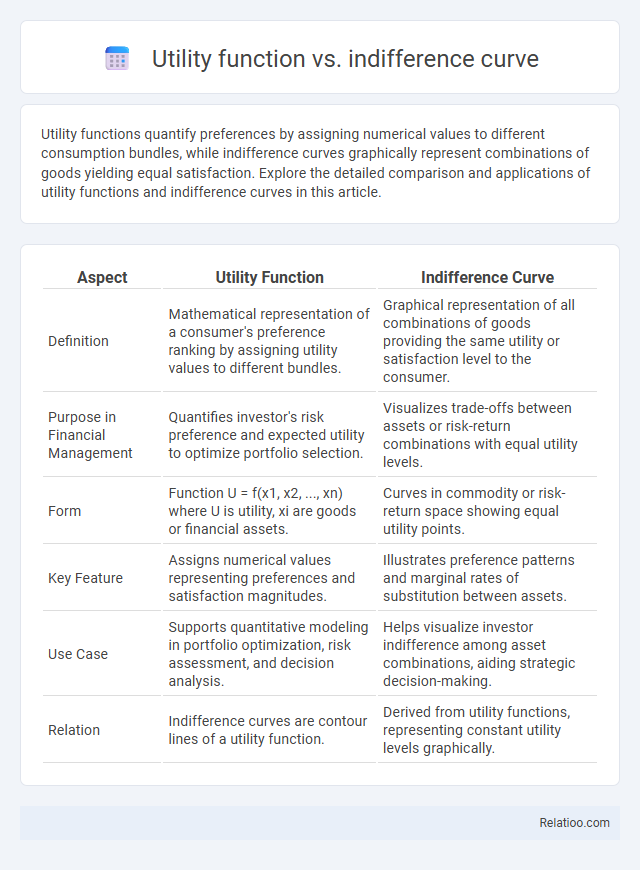
Utility functions quantify preferences by assigning numerical values to different consumption bundles, while indifference curves graphically represent combinations of goods yielding equal satisfaction. Explore the detailed comparison and applications of utility functions and indifference curves in this article.
Table of Comparison
| Aspect | Utility Function | Indifference Curve |
|---|---|---|
| Definition | Mathematical representation of a consumer's preference ranking by assigning utility values to different bundles. | Graphical representation of all combinations of goods providing the same utility or satisfaction level to the consumer. |
| Purpose in Financial Management | Quantifies investor's risk preference and expected utility to optimize portfolio selection. | Visualizes trade-offs between assets or risk-return combinations with equal utility levels. |
| Form | Function U = f(x1, x2, ..., xn) where U is utility, xi are goods or financial assets. | Curves in commodity or risk-return space showing equal utility points. |
| Key Feature | Assigns numerical values representing preferences and satisfaction magnitudes. | Illustrates preference patterns and marginal rates of substitution between assets. |
| Use Case | Supports quantitative modeling in portfolio optimization, risk assessment, and decision analysis. | Helps visualize investor indifference among asset combinations, aiding strategic decision-making. |
| Relation | Indifference curves are contour lines of a utility function. | Derived from utility functions, representing constant utility levels graphically. |
Introduction to Utility Functions and Indifference Curves
Utility functions represent your preferences by assigning numerical values to different bundles of goods, allowing for a quantifiable measure of satisfaction. Indifference curves graphically illustrate combinations of goods that provide the same level of utility, highlighting how you trade off between various options without changing your overall happiness. Understanding both concepts is essential for analyzing consumer choice and optimizing your decision-making in economics.
Definition and Concept of Utility Function
A utility function represents a mathematical expression that assigns a numerical value to each possible bundle of goods, reflecting Your preference ranking and satisfaction level. Indifference curves graphically depict combinations of goods between which a consumer remains indifferent, meaning each point on the curve yields the same utility value. Utility, as a core concept in economics, measures the overall satisfaction or happiness derived from consuming goods and services, which the utility function quantifies to analyze consumer behavior efficiently.
Understanding Indifference Curves
Indifference curves represent combinations of goods that provide You with the same level of satisfaction, reflecting consumer preferences without assigning specific utility values. Unlike utility functions that quantify satisfaction numerically, indifference curves visually demonstrate trade-offs and substitution effects between goods. Understanding these curves helps analyze how Your choices change with varying consumption bundles while maintaining constant utility.
Cardinal vs Ordinal Utility Theory
Utility function quantifies satisfaction using cardinal utility theory by assigning specific numerical values to preferences, enabling measurable comparisons. Indifference curves represent ordinal utility theory by illustrating combinations of goods that provide Your consistent level of satisfaction without attaching precise values. Understanding these distinctions helps analyze consumer choices through measurable utility or preference rankings.
Mathematical Representation of Utility Functions
Utility functions mathematically represent consumer preferences by assigning numerical values to different bundles of goods, allowing for the quantitative analysis of satisfaction levels. Indifference curves graphically illustrate combinations of goods that yield the same utility, providing insight into consumer choice without specifying exact utility values. Your understanding of these concepts enhances economic modeling, emphasizing the link between utility functions and the geometric properties of indifference curves in decision theory.
Graphical Analysis of Indifference Curves
Indifference curves graphically represent combinations of goods providing equal utility, illustrating consumer preferences without assigning explicit utility values. Unlike utility functions, which quantify satisfaction through a numerical scale, indifference curves emphasize the trade-offs between goods maintaining constant utility levels. Utility measurement relies on ordinal ranking, making indifference curves a crucial tool for visualizing marginal rates of substitution and consumer equilibrium in microeconomic analysis.
Relationship Between Utility Functions and Indifference Curves
Utility functions represent numerical values assigned to different bundles of goods reflecting Your satisfaction level, while indifference curves graphically illustrate combinations of goods yielding equal utility. Each point on an indifference curve corresponds to the same utility score derived from the utility function, highlighting the principle that these curves are contour lines of the utility function. The relationship shows that utility functions provide the underlying quantitative measure, and indifference curves visualize preferences without assigning explicit numerical utility values.
Assumptions Underlying Both Concepts
Utility functions assume that You have consistent preferences that can be represented mathematically, allowing for the ranking of different bundles of goods. Indifference curves rely on assumptions such as completeness, transitivity, and non-satiation to depict combinations of goods that provide equal satisfaction. Both concepts assume rational behavior and continuous preferences, enabling the modeling of consumer choice in economic analysis.
Applications in Consumer Choice Theory
Utility functions quantify the satisfaction a consumer derives from different bundles of goods, enabling precise modeling of preferences in Consumer Choice Theory. Indifference curves represent combinations of goods yielding equal utility, providing a graphical tool to analyze trade-offs and consumer decisions. Understanding these concepts helps you predict consumer behavior and optimize choices in response to budget constraints and market changes.
Key Differences and Comparative Analysis
Utility functions quantify your preferences by assigning numerical values to different bundles of goods, reflecting the level of satisfaction derived. Indifference curves graphically represent combinations of goods between which you are equally satisfied, illustrating your trade-offs without specifying exact utility values. While utility functions provide a precise measurement of utility, indifference curves emphasize the relative preference structure, distinguishing the conceptual approach from the numerical evaluation of utility.

Infographic: Utility Function vs Indifference Curve
 relatioo.com